Guided walkthrough

How to use ProDI-DB

Whether you are searching for a specific protein or exploring the database by category, this guide explains the available features and workflows to help you navigate ProDI-DB efficiently. It provides step-by-step instructions for searching, browsing, interpreting protein and structure records, and downloading datasets and information for your research

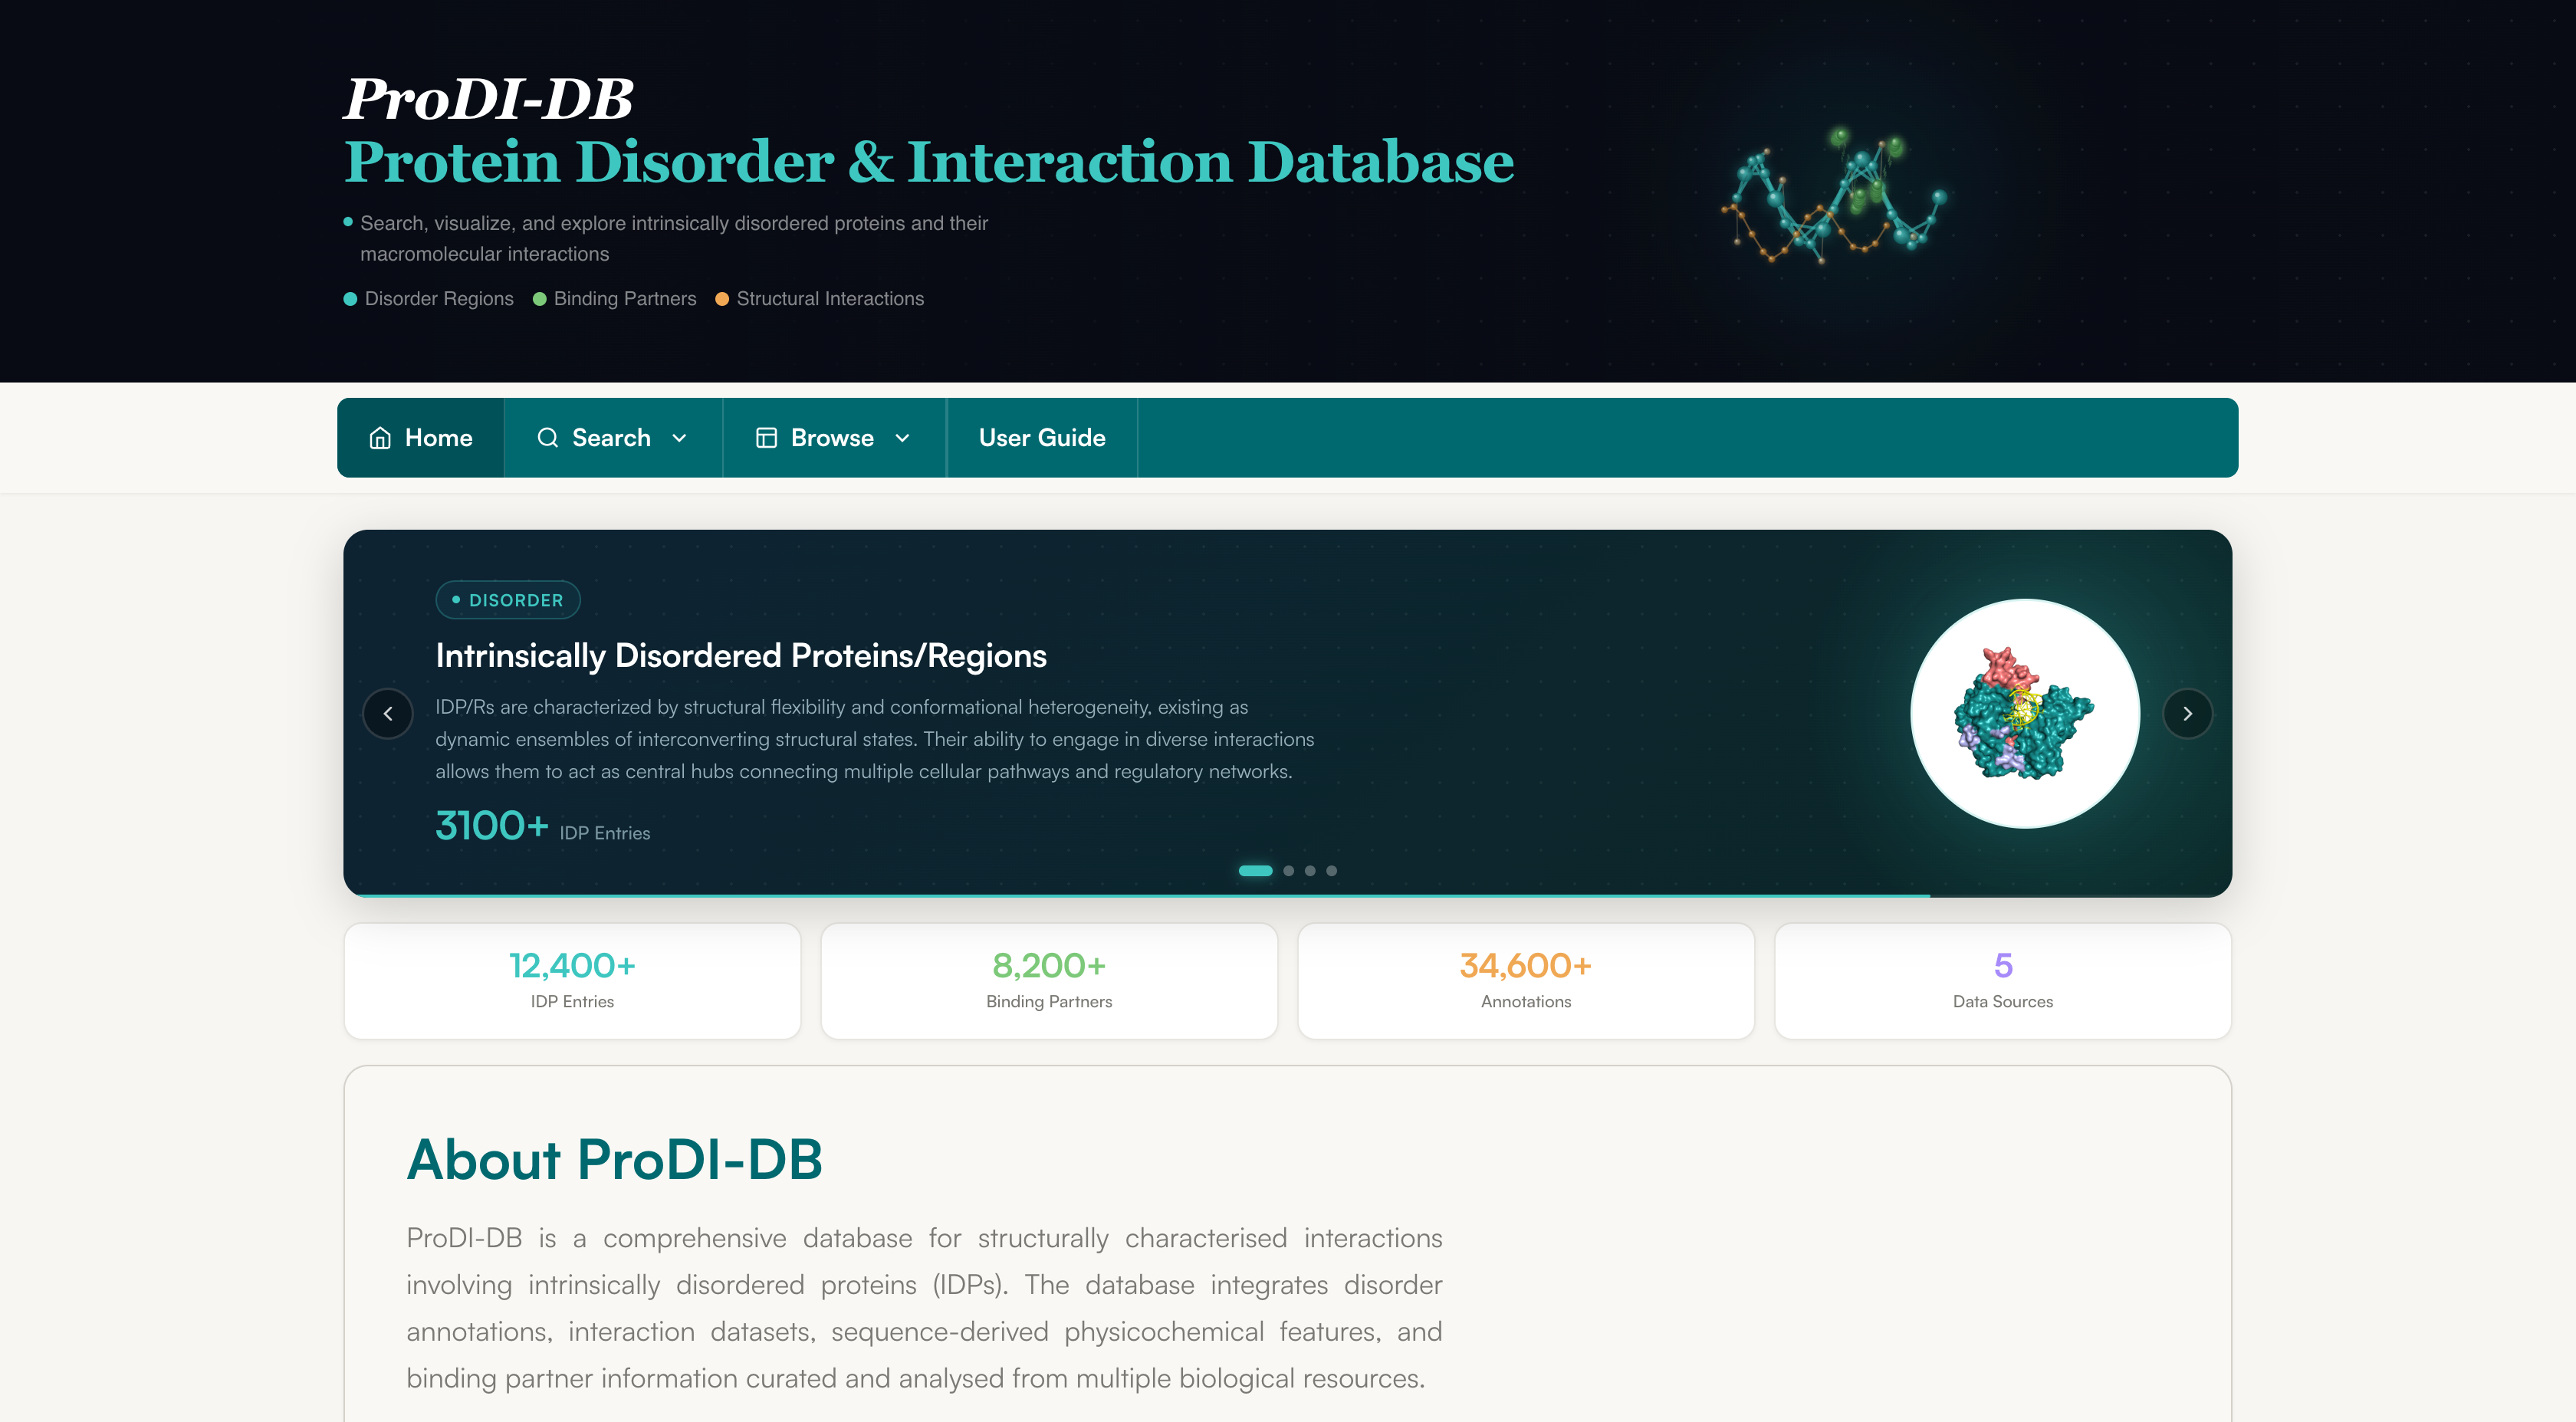
ProDI-DB home page

Database Overview

ProDI-DB integrates experimentally validated disorder annotations with structural and interaction information to provide a comprehensive view of intrinsically disordered proteins and regions. Users can retrieve, explore, and compare protein records through searchable and browsable datasets designed for biological and structural analyses.

Core Workflows

  • Home — provides an overview of the database, its contents, and quick access to major features.
  • Search — enables targeted retrieval of proteins, structures, and disorder annotations using identifiers and keywords.
  • Browse — allows systematic exploration of protein, structure, organism, and interaction datasets through interactive tables and filters.
  • Protein Records — provide integrated views of sequence, disorder, structural, and interaction information for individual proteins.

What Users Can Accomplish

  • Identify proteins using ProDI-DB, UniProt, DisProt, or PDB accession identifiers.
  • Explore disorder annotations and experimentally validated intrinsically disordered regions.
  • Examine structural information including available protein structures, experimental methods, and interaction partners.
  • Analyze molecular interactions involving proteins, nucleic acids, ligands, and other biomolecules.
  • Filter, compare, and export datasets for downstream computational and biological analyses.

Browse Module

The Browse module enables users to explore the complete ProDI-DB datasets without requiring a specific search query. Records are organised into four curated datasets, each providing a unique perspective on the data.

By Protein

Protein-centric

Provides a protein-centric view of ProDI-DB. Each record contains the corresponding Protein ID, UniProt ID, protein and gene names, organism, taxonomy, cellular location, and other sequence- and structure-related annotations.

In addition to the basic protein information, the table includes several disorder and physicochemical properties, such as:

  • Number of Disordered Regions — total experimentally validated IDRs present in the protein.
  • Disorder Classification — categorises proteins according to their overall disorder content.
  • Disorder Content (%) — percentage of residues experimentally annotated as disordered.
  • Number of Structures — total experimentally determined structures available for the protein.
  • Binding Mode — types of macromolecular interactions associated with the protein.
  • Physicochemical properties — Theoretical isoelectric point (pI), Instability Index (Predicted protein stability index), Grand Average of Hydropathy (GRAVY) Score, and Molecular Weight – useful for comparative protein analysis.
  • Virus Hosts — reported only for viral proteins, where applicable.

By Disordered Regions

Region-centric

The By Disordered Regions dataset focuses on individual experimentally validated intrinsically disordered regions. Each entry is assigned a unique Region ID, which is generated by combining the corresponding Protein ID with a sequential region number (e.g., P000123-R1, P000123-R2), allowing each disordered region within a protein to be uniquely identified. The dataset also links each region to its corresponding Protein ID, UniProt ID, and DisProt ID..

The dataset further reports:

  • Start and End Positions defining the residue boundaries of each disordered region.
  • Length (aa) and Contribution (%), indicating the size of the region and its contribution to the overall disorder content of the protein.
  • Amino acid composition statistics, including the percentages of polar, non-polar, charged, and aromatic residues, enabling users to compare the compositional characteristics of different disordered regions.

By Interactions

Interaction-centric

Provides a summary of all experimentally determined macromolecular interactions associated with each protein. Each entry lists the corresponding Protein ID, associated PDB structures, and the total number of experimentally determined structures available for that protein.

To enable method-specific exploration, interaction records are organized into separate tabs based on the experimental method, including All, X-ray Diffraction, Nuclear Magnetic Resonance (NMR), and Electron Microscopy (EM). Selecting a specific tab displays only the structures determined using the corresponding experimental technique.

Within each experimental category, interaction data are further classified according to the interacting partner type:

  • Protein-RNA (P-R) interactions
  • Protein-DNA (P-D) interactions
  • Protein-Nucleic Acid Hybrid (P-NAH) interactions
  • Protein-Protein (P-P) interactions
  • Protein-only structures (with no interacting partners)
  • Structures containing ligands

For each interaction category, the dataset reports the number of available structures, the corresponding PDB entries, and the participating macromolecular entities (protein, DNA, RNA, or hybrid nucleic acid entities), allowing users to quickly identify proteins with specific interaction types.

Note: P-NAH refers to Protein-Nucleic Acid Hybrid interactions. This category includes structures involving DNA-RNA hybrid molecules as well as complexes in which DNA and RNA are present simultaneously, and is therefore reported separately from Protein-DNA (P-D) and Protein-RNA (P-R) interactions.

By PDB Structure

Structure-centric

Provides a structure-centric view of ProDI-DB. Each entry corresponds to an experimentally determined structure associated with one or more proteins in the database. The Protein ID column lists all ProDI-DB protein entries mapped to the corresponding PDB structure, as a single structure may be associated with multiple protein entries.

In addition to the PDB ID and associated Protein ID(s), the dataset includes comprehensive structural metadata, including the structure title, experimental method, resolution, structural classification, partner type, and the numbers of protein, DNA, RNA, and hybrid nucleic acid entities present in the structure. Bibliographic metadata, including the PubMed ID (PMID), DOI, and PDB deposition date, are also provided to facilitate access to the original structural study.
    Shared Table Features

    All browse datasets provide a common set of interactive features to facilitate efficient exploration and analysis.

    • Records can be searched using keywords or identifiers in the Search bar.
    • Individual columns can be filtered to refine the displayed results.
    • Sort records by individual columns.
    • Rows can be selected individually or in bulk for further operations.
    • The number of displayed records can be adjusted to 25, 50, 100, or 200 entries per page.
    • Selected or filtered datasets can be exported in CSV format for downstream analysis.

    Protein Page

    The Protein Page serves as the main information page for each ProDI-DB entry, integrating protein’s sequence, disorder, structural, and interacting partners information into a single protein-centric view. Users can access the comprehensive annotations, visualize the mapped disordered regions, explore associated structures, and examine residue-level structural coverage.

    Protein Summary

    The top Header Section displays the Protein ID, protein name, and quick-access links to the corresponding UniProt and DisProt entries. A Download option is also provided, allowing users to export all information associated with the protein entry as a text file.

    The Protein Summary panel provides general protein information, including the protein and gene names, organism, kingdom, UniProt accession, protein length, cellular location, and amino acid sequence. The sequence can be expanded or collapsed for convenient viewing and can also be downloaded in FASTA format

      Disorder Summary

      The Disorder Summary section summarizes the overall annotations of intrinsic disorder together with detailed information on the disordered regions identified within the selected protein.

      It reports:

      • Disorder Classification – Proteins are classified according to their Disorder Content (%) into three categories: (i) Less Disordered: <30% disordered residues, (ii) Moderately Disordered: 30-80% disordered residues and (iii) Highly Disordered: >80% disordered residues
      • Disorder Content (%) – Percentage of amino acid residues annotated as intrinsically disordered in DisProt, calculated relative to the full-length protein sequence.
      • Total number of intrinsically disordered regions (IDRs).
      • Total number of disordered residues.

      A detailed table of the disordered regions is also provided. Each entry includes the Region ID, residue boundaries, region length, percentage contribution to the overall disorder content, and amino acid composition, including the percentages of polar, non-polar, charged, and aromatic residues. The Contribution (%) indicates the proportion of the protein's total disorder content accounted for by each individual disordered region, facilitating comparison of their relative significance within the protein. Hovering over the particular region will highlight the disorder segment in the graphical representation provided below the table.

      Sequence Disorder Map

      The Map provides a graphical representation of all the IDRs across the complete protein sequence.

      • Ordered regions are represented in grey.
      • Disordered regions are represented in teal.

      Users can:

      • Hover over a disordered segment to view a summary card displaying the Region ID, residue range, region length, and contribution to the overall disorder content.
      • Click View Sequence to expand the sequence view, displaying the amino acid sequence together with residue numbering.
      • Use the sliding window to navigate along long protein sequences.
      • Use Collapse Sequence to return to the compact graphical representation.
      • Download the disorder map as an SVG image. The exported figure includes annotation cards for each disordered region containing the corresponding region identifier, residue range, length, and contribution.

      Structural Interaction Summary

      This section summarizes the information on experimentally determined structures of the protein available in the Protein Data Bank (PDB). The summary includes:

      • Total number of associated structures.
      • Number of structures determined by diff experimental methods- X-ray diffraction, NMR and EM.
      • Number of structural entries where disordered regions are mapped within the structures.
      • Types of interacting partners observed across all associated structures. These include Protein, RNA, DNA, Nucleic Acid Hybrid (NAH), and Unbound (when no interacting macromolecular partner is there for a structural entry of the protein.

      PDB Structure Data

      All experimentally determined structures associated with the protein are listed in the PDB Structure Data table. Structures can be viewed separately according to their experimental method through the All, X-ray, NMR, and EM tabs. Each structure is accompanied by structural metadata, including the PDB ID, title, experimental method, resolution, structural classification, interacting partner type, number of different entities in the protein and the publication details of the entry.

        Interaction Structure

        The Interaction Structure section provides residue-level structural coverage information for each experimentally determined structure. For every structure, the table reports:

        • Chains- Displays the chain identifier(s) corresponding to the disordered protein entry whose Protein Page is currently being viewed.
        • Covered Regions, indicating the residue ranges resolved in the experimental structure.
        • Coverage (%), representing the percentage of the full-length protein sequence covered by experimentally resolved residues in the structure.
        • N-terminal Missing, Internal Missing, and C-terminal Missing regions, identifying unresolved portions of the protein.
        • Comment, providing an overall interpretation of the structural coverage.
        • Disordered Region, indicating disordered regions mapped in the structure.
        • From the last column of each entry, user is provided with an option to view the structure in the expanded mode.

        Selecting the View , in both the tables- Interaction Structures and PDB Structure Data, loads the corresponding three-dimensional structure in the molecular viewer provided beside the table.

        Interactive 3D Structure Viewer

        The integrated 3D Structure Viewer enables interactive visualization of experimentally determined structures together with mapped chains of disordered protein (called as Target protein chains).

        The viewer displays the structure in cartoon form, with Target protein chain(s) in red, IDRs in yellow, other Protein partner chains in green and Nucleic acid chains in blue, where present. The Ligands, whenever present, are in Ball-n-Stick representation

        The viewer provides several interactive controls within the viewer, including:

        • Zoom-in and Zoom-out.
        • Reset to restore the default orientation of the structure.
        • Expand to open the viewer in a larger window.
        • The structure can be explored interactively using the mouse cursor. Left-click and drag to rotate the structure about its axes, right-click and drag to translate (pan) the structure within the viewer, and use the mouse scroll wheel to zoom in and out. Hovering over an atom displays its corresponding atomic information.
        • For structures determined by NMR, users can switch between individual conformational models using the Model selector, provided in the upper right side of the viewer.
        • A direct View on RCSB link is also available, allowing users to open the corresponding entry in the RCSB Protein Data Bank for additional structural information.

        Download Options

        ProDI-DB provides multiple download options to facilitate data retrieval and downstream analyses. Users can download:

        Complete Protein Record .txt

        Export all information associated with the selected protein entry as a text (.txt) file using the Download option available in the upper-right corner of the Protein Page.

        Protein Sequence FASTA

        Download the amino acid sequence in FASTA format.

        Disorder Map SVG

        Export the graphical representation of the sequence disorder map as an SVG image. The downloaded figure includes annotation cards summarizing the experimentally validated disordered regions.

        Browse Datasets CSV

        Export selected or filtered records from the Browse module in CSV format.

        These download options enable convenient access and data usage for visualization, analysis, and integration into downstream bioinformatics workflows.

        Contact and Support

        For questions, suggestions, or to report technical issues related to ProDI-DB, users are encouraged to contact on abarik.bt@nitdgp.ac.in.

        When reporting an issue, users are requested to provide the relevant Protein ID, PDB ID, or Region ID (where applicable), along with a brief description of the problem. This information helps facilitate timely investigation and resolution.

        We welcome feedback and suggestions from the research community to further improve the functionality and content of ProDI-DB.